Explanation of Power Supply/Demand Notification
The notification of power supply/demand provides information about the actual status of daily power usage by customers and power supply capacity by Kansai Transmission and Distribution. It is intended as reference for saving energy.
The expected supply/demand situation for the current/following day and the actual power supply/demand of the current day are shown in graphs or data.
- * The “Next-day forecast” is issued at about 18:30 every day.
- * The numerical values of the “Today’s forecast” are reviewed at about 9:30 every day.

- 1 Expected maximum power
- 2 Power supply capacity in above time slot
- 3 Expected usage ratio (%)
Expected
usage ratio (%)= Expected maximum power
(power usage)× 100 Power supply capacity in this time slot - 4 Current power usage status

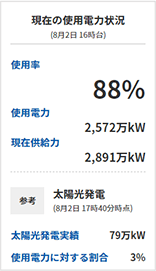
The severity of the current demand/supply situation is indicated, as judged by comparing the actual power usage announced every hour with the supply capacity in that time slot.
For reference, the actual solar power generation value for every 5 minutes and its ratio in the overall power usage are also shown. - 5 Actual result of solar power generation
This is the actual result of the solar power generation in the Kansai area. It is an estimated value calculated based on the solar radiation estimated from satellite images.
- * Due to data unavailability caused by communication issues or the like, the indication may temporarily not be shown.
- 6 Next-day forecast
The “Next-day forecast” is notified in the same format as “Today’s forecast.”
It is issued at about 18:30 every day.
Causes for Daily Changes in Supply Capacity
Information for Foreign Residents of Japan Menu

